Real-Time Financial Data Visualization for 2026 Markets
Gidlety's trading charts deliver institutional-grade candlestick analysis with sub-second latency. Visualize market volatility, track price action across multiple timeframes, and execute decisions with precision data.
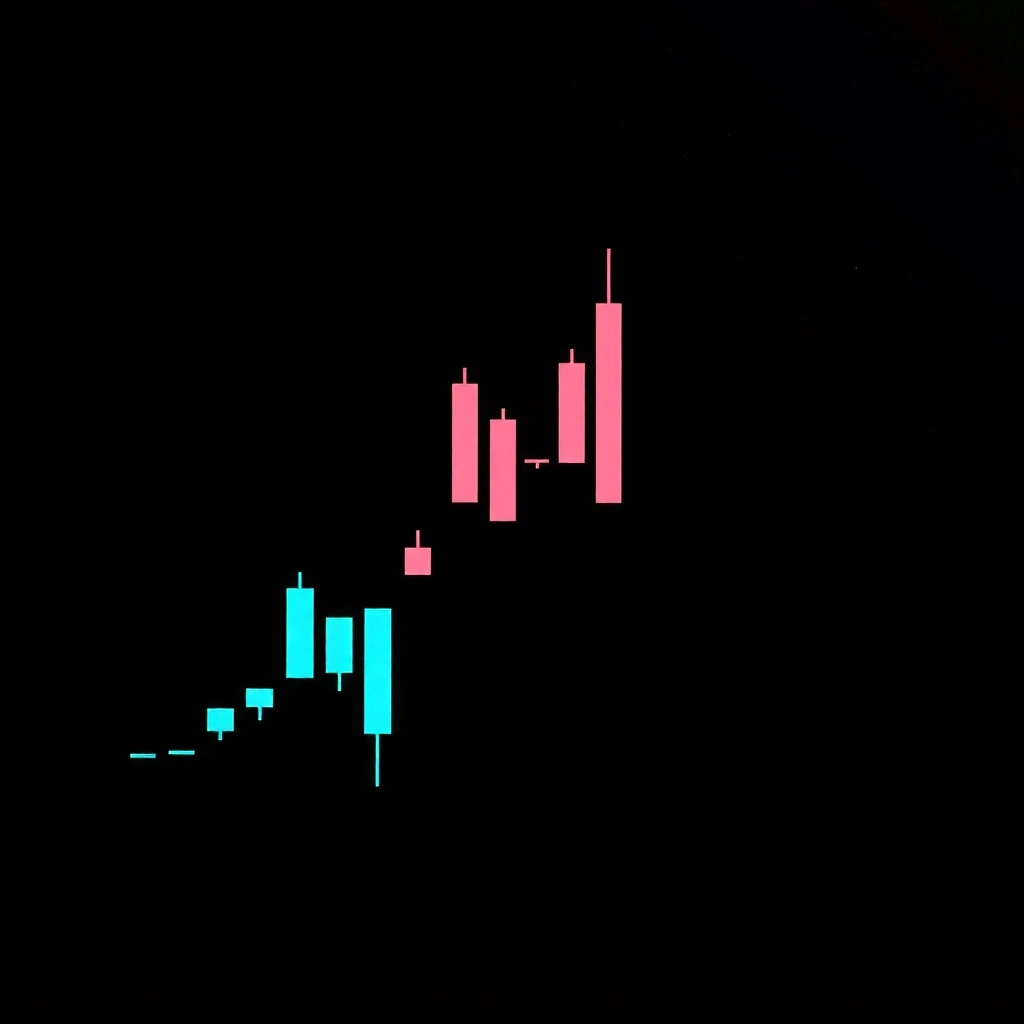
[Interactive Chart Module]
Requires backend data stream
Live Data Visualization
Interactive candlestick chart demonstration area. Use the hook data-action="load-chart" to render financial data. Clean, functional rendering without distracting animations.
Candlestick Display Module
This container awaits backend data injection via the deterministic plugin runtime. Configure your data stream to populate OHLCV values (Open, High, Low, Close, Volume) for real-time visualization.
Why Candlesticks?
Candlestick charts provide a clear snapshot of market volatility and price action that standard line graphs simply cannot match. Each candle tells the story of a specific time period—the battle between bulls and bears is visualized through precise open, high, low, and close data points.
Gidlety Field Guide: Reading the Signals
Core Concept
A candlestick consists of a real body (the open-to-close range) and wicks (shadows) showing the session's extremes. Long bodies indicate strong buying or selling pressure. Short bodies suggest indecision. The relationship between body length and wick length reveals conviction—or lack thereof—in the current price direction.
Decision Criteria
- • Magnitude: Body size >2x average = significant momentum shift
- • Position: Candles near resistance/support lines have higher predictive value
- • Pattern: Multiple candles forming "engulfing" or "doji" shapes signal reversals
- • Volume: High volume with price movement confirms legitimacy
Myth vs. Fact
MYTH:
"Candlesticks guarantee future price movements."
FACT:
They show probability based on historical patterns. Success requires combining technical signals with market context and risk management. No single indicator is infallible.
Common Mistakes
- ✕ Overtrading on single-candle signals without confirmation
- ✕ Ignoring volume context (price moves on low volume are suspect)
- ✕ Using default timeframes without matching your trading style
- ✕ Failing to set stop-losses based on candle structure
Key Terminology
Implementation Workflow
Define Constraints
Specify asset class, timeframe (1m, 15m, 1h, 1d), and data granularity. Gidlety engine adapts to forex, crypto, or equity feeds.
Validate Data Source
Connect WebSocket or REST endpoint. Test latency <50ms. Validate OHLCV structure matches Gidlety schema for automatic parsing.
Apply Visualization
Initialize the rendering hook. Color-code by momentum (green/red). Toggle between linear and log scales for volatility analysis.
Review & Iterate
Analyze pattern recognition accuracy. Adjust smoothing parameters. Export configuration for consistent multi-chart deployment.
Technical Indicators & Quality Benchmarks
Example benchmark: Enterprise-tier feed processing speed for high-frequency strategies. Actual performance depends on network infrastructure.
Example guarantee: Redundant server architecture with automated failover. Service availability tracked in real-time.
Example standard: ISO 27001 certified data handling. Cryptographic verification of data chains for audit trails.
Scenario-Based Feedback
"Gidlety's 1-minute candlestick rendering helped identify a breakout on GBP/JPY that wasn't visible in our standard line charts. The visual gap analysis was crucial."
— Example: Retail FX Strategy Consultant
"Integration took under an hour. The clean documentation meant our dev team didn't need to reverse-engineer the visualization logic."
— Example: FinTech Platform Lead